Debugging a HardFault is ROUGH, but with trace debugging, it’s a joy! A big problem with debugging firmware on a System-on-Chip (SoC) design is that the CPU and memory are encased in a plastic package severely limiting the visibility of what the CPU is doing. There are tons of interrupts and exceptions and just plain old bugs in your software that can send the CPU off into la-la land and you have no way of tracking down how it got there. Good ‘ol PRINTFs do not help since the CPU has gone off the rails. The most common method of debugging this kind of fault is to keep removing code or disabling interrupts until you magically divine the cause by inspection after a lot of tedious narrowing of possible causes and reverting checkins. In this post I’ll describe the joys of debugging using the Segger J-Trace and the Ozone debugger.
ARM CoreSight Architecture
ARM CPUs are intended to be implemented in SoCs so naturally ARM designed in a set of tools to enable visibility and debugging called the CoreSight architecture. For the embedded Cortex processors, and specifically the CM33 in the EFR32ZG23, the key components are the ARM ETMv4 which then feeds the TPIU. The ETM/TPIU tracks the CPU Program Counter (PC), packetizes changes in the PC and thus the program flow, compresses the data, then sends it out the trace pins to an external Trace Port Analyzer such as the Segger J-Trace. The Segger tools decompress and decode the trace data to match it with the image file of the compiled code to show exactly the path the program followed. ARM has a huge amount of documentation on their web site but the problem is there is too much information. ARM has many CPUs, architectures, versions and the entire ETM is an optional component with many configurable parts. This makes reading the ARM documentation much like reading the dictionary, lots of detailed information but it is tough to follow the story of how the pieces work together. Fortunately, Segger has read the documentation and figured out how to make it work.

Segger J-Trace and Ozone Debugger
Segger is well known in the embedded industry for their J-Link hardware programmers, the Ozone debugger and lots of other services. They have wide support for virtually every MCU made including all of the Silicon Labs EFR32 chips. Their support for Trace debugging is excellent with reliable hardware and software. The Ozone debugger is able to read in your .AXF file out of Simplicity Studio, find all the source code, connect to the DUT via the J-Trace (which includes a J-Link for programming/debug), download the firmware in seconds and run to Main and then display the path your firmware took to get there. Easy and fast!

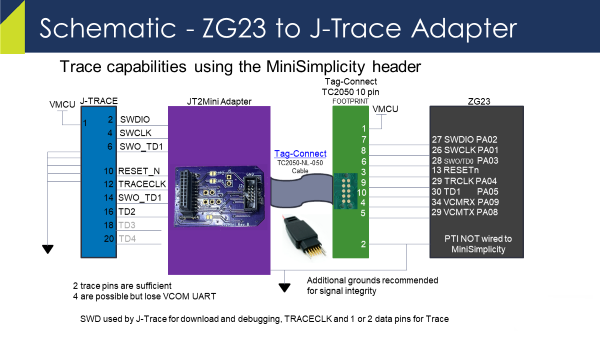
The Segger J-Trace Pro Cortex-M is required for Trace Debugging. While not, cheap, it’s also not expensive compared to the cost of an engineer working for days trying to capture how their firmware dropped into the weeds. The J-Trace connects to your PCB via a 20 pin header that is 50mil on centers so it is quite small. However, I’ve come up with a small PCB that lets you use the standard 10 pin MiniSimplicity header for Trace.
etm_zwave Github Repo and J2Mini Adapter
Most Z-Wave IoT products have very small PCBs and no room for another 20 pin header even if it is 50mil. I came up with a simple way to use the existing 10 pin tag-connect/MiniSimplicity header for Trace and placed all the files in a public github called etm_zwave. You do have to connect a couple of extra pins from the ZG23 to the tag-connect/MiniSimplicity header. Replace the PTI pins with the trace clock and a second data pin – the first data pin is the SWO pin already on the header. This header is tiny and you need a way to program the ZG23 anway and this is the way to go. The PTI pins are not that useful as they are only used for radio packet tracing which Z-Wave uses standalone Zniffers instead of wiring multiple nodes to the Network Analyzer. For less than $30 you can build your own JT2Mini adapter boards and then be able to use trace with just the MiniSimplicity header. You will need a extra ground connection as there is a single ground pin on the MiniSimplicity header. I’ll discuss that issue more in the troubleshooting section below.
Setup Trace in Ozone
Now that the hardware is wired up, we have to enable Trace in Ozone.
- Open Ozone
- Include the *.JlinkScript file in the etm_zwave github repo
- For the ZG23 use ZG23_Traceconfig.JLinkScript
- There are comments in the file and more info in the repo ReadMe.md on how to properly insert the script into your Ozone *.jdebug project file.
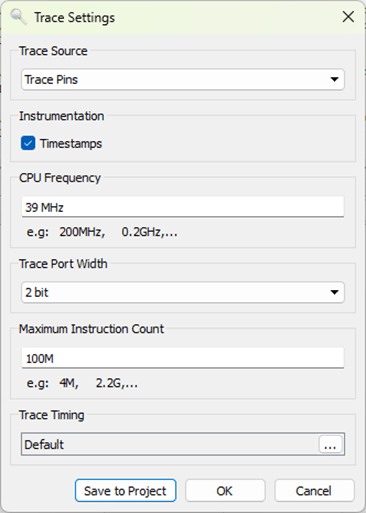
- Click on Tools->Trace Settings
- Change the Trace Source to Trace Pins
- CPU Frequency=39MHz
- Trace Port Width=2 (if using JT2Mini)
- Click on Green Power button
- Ozone will download the code and run to MAIN()
- Open the Timeline and Code Profile windows
The TimeLine should look something like this – maybe “run” for just a fraction of a second:

This window shows how long the CPU has been in each function and the complete program flow in real time. Interrupts and switching RToS tasks are shown and make it much easier to immediately find where the hardfault occurred. Clicking in the timeline brings up the exact line of C code and optionally disassembly at that instant in time. You can quickly follow exactly where your code went wrong and the hardfault occurred.
The Timeline window also allows you to immediately see how long each function is taking. What is most important here is checking your interrupt service routines to ensure they are not busy burning a lot of CPU time doing less important work and starving other time sensitive functions. The obvious waster of time is the memset and memcpy functions which I am working on another post about those specific functions so stay tuned!
Ozone has a Code Coverage window which displays the number of lines of code that have been executed and the number of assembly instructions executed. Using this feature with a product validation suite you can quickly identify untested and potentially dead code.

Segger has plenty of training videos that go into a great deal of detail on how to use these tools. But first you need a J-Trace and get it wired up to your board.
How to get printfs via J-Trace
Unfortunately the Segger J-Trace Pro does not support the VCOM serial interface. Thus, if you want to open a terminal window and see the printfs in your code, you have to jumper the Rx/Tx pins (and ground) to a Serial to USB adapter. Fortunately I put a header on the JT2Mini PCB for exactly this purpose. The J5 header has the Rx (Pin 1 square pad) and Tx pins on it (Pin 2 round pad). J3 has ground on both pins. Use an FTDI serial to USB adapter and PuTTY or other serial terminal program to view the printfs. The DevKit EXP pins should be able to read in the serial data but I was not able to find the right combination of In/Out/MCU and AEM/Bat/USB and get SSv5 to work. Thus I recommend using a simple FTDI interface to watch the printfs when tracing.
Troubleshooting
The number one challenge with getting Trace to work is the signal integrity of the clock and the trace data pins. Once you have a clean connection, it seems to be rock stable and produces really valuable debugging data even with just two data pins. If Ozone if giving strange errors and specifically different errors with each run, odds are you have a signal integrity problem.

The EFR32 Series 2 (including the ZG23) GPIOs have only a 20MHz bandwidth. The Trace clock is a divide by 2 of the 39MHz CPU clock so it is running right at the maximum of the GPIO. Trace data is clocked out on both edges of the clock. Since the MiniSimplicity header has only 1 ground on it and there are at least 3 GPIOs toggling at their maximum rates, the signal integrity is marginal even in the best of circumstances. The JT2Mini has extra ground pins and I highly recommend connecting them with additional jumper wire while using Trace. The cable from your board to the JT2Mini should also be no more than 6 inches long. The .JlinkScript file has code in it for adjusting the slew rate of the GPIOs which can improve or possibly degrade the trace signal integrity. Ozone and J-Trace can also adjust the relative timing of the CLK to the data with sub-nanosecond resolution. You’ll have to experiment on your own if you are having problems.
Conclusion
I can’t live without Trace debugging. I don’t necessarily use it all the time but I will wire it up to every board I design in the future! I have spent weeks debugging hardfaults in the past and then solve the problem in 10 minutes using Trace. Get one for yourself!
See many of you next week at the Z-Wave Summit in Orlando Florida where I will be giving a presentation on The Joys of Trace Debugging and running the UnPlugFest on Monday!
