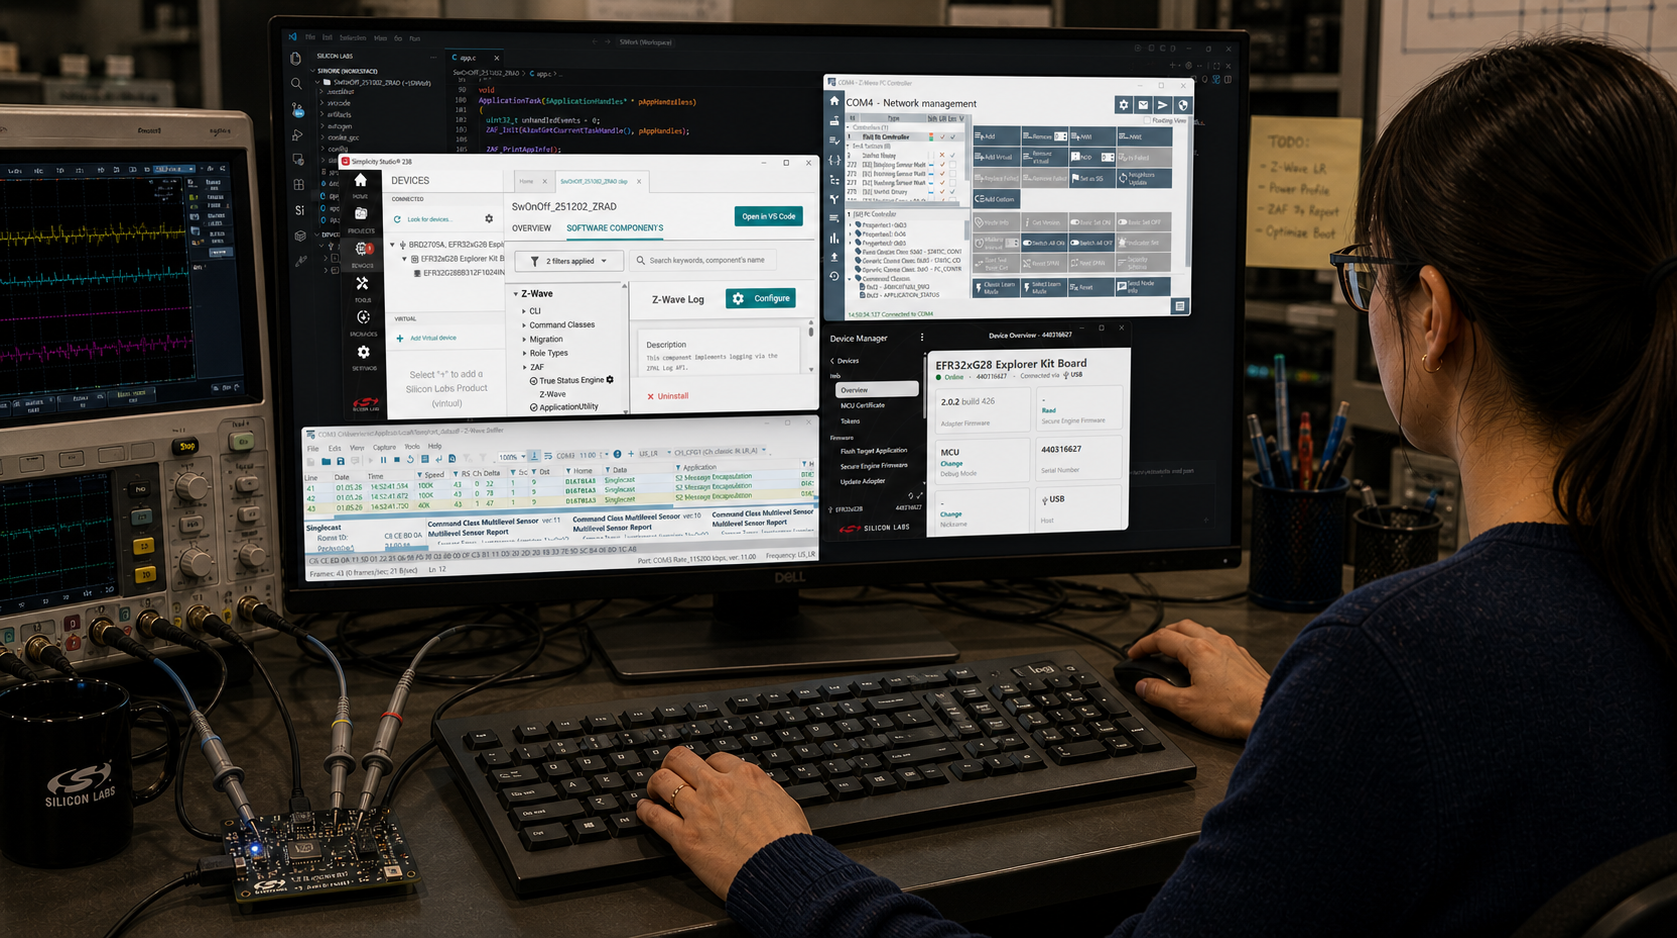
A Z-Wave Developer’s Journey | Part 5

Z-Wave Firmware Hardening

How to avoid truck rolls though resilient firmware coding techniques

This is an abbreviated version of the full blog on the Z-Wave Alliance website.

Every IoT device has bugs. Today’s devices have many thousands of lines of code and too many hardware features meaning there are plenty of bugs hiding in every device. Bugs are in your product. I know it, and you know it. I propose that the best solution for these bugs is to “harden” your firmware to make it more resilient and keep on truckin’ if something bad happens. Below are my Tips and Techniques for hardening Z-Wave firmware to survive a failure. These ideas are for Silicon Labs SDK but similar techniques apply to Trident IoT.

Seven Tips to Harden Z-Wave Firmware

  1. Assume Everything is Broken
  2. Use FOR Instead of WHILE
  3. Replace Default_Handler
  4. Enable the Other Watchdog
  5. Reboot if no Comms in a Day
  6. Enable Stack Overflow Checking in FreeRTOS
  7. Run Static Analysis Tools

1. Assume Everything is Broken

This is a philosophical idea you need to keep in the back of your mind with every line of code you write. Assume everything is broken all the time – hardware never goes “ready”, a queue is always full, a mutex never switches, an impossible state occurs and similar sorts of failures. The most common code technique is to always check for error conditions of any function that returns a value. Always check inputs for validity.

The most insidious failures are stack overflows. This can happen where parts of RAM are overwritten and I’ve found it amazing that the code can keep running even after trashing potentially hundreds of memory locations. The challenge is there is no way to predict what might happen. All sorts of things that “can never happen” absolutely will happen when the stack overflows. Due to the limited RAM on Z-Wave chips, it is easy to overflow the stack.

Another common impossible condition is when the power supply sags just enough to flip bits in ways that are technically impossible. Strong magnetic fields from nearby motors and even cosmic radiation can flip bits in impossible ways. There is truly nothing that “can’t happen”. Thus, always code with the thought that the impossible can happen because eventually it will.

Wireless IoT devices using Z-Wave are often wired directly to mains-power. They cannot be easily rebooted like you do with your computer when it freezes. If a device bricks, it’s dead potentially for months or even years before a power failure brings it back online. Once a device is wired in, it’s usually there for many years and with Z-Wave it can be decades. Ensuring the firmware is resilient when (not if!) the impossible occurs will keep customers happy since they never knew the device rebooted – it kept on truckin’.

2. Use FOR instead of WHILE

The Silicon Labs SDK, including the bootloader, has many while(hardware_busy) loops that will wait forever and can cause the device to brick. For example, in Silicon Labs if you enable the LFXO (32KHz crystal oscillator) but don’t have the crystal wired up, the startup code waits for the LFXO to be “ready” with a while loop. While this is obvious when debugging firmware, this loop causes a device in the field to brick if for some reason the crystal stops working. The simple solution to this is to add a FOR loop with a timeout enabling the code to continue.

Example in em_cmu.c:

Replace: while ((LFXO->STATUS & _LFXO_STATUS_ENS_MASK) != 0U) {  }

With: for (int i=0; (i<1000)&&((LFXO->STATUS & _LFXO_STATUS_ENS_MASK) != 0U); i++) {__NOP()}

Note the __NOP() is necessary to prevent the compiler from optimizing the loop and removing it. The timeout value (1000 in this case) must be chosen based on testing. I usually set it to 10X the typical value. Following the FOR should be an assert to check that the timeout didn’t occur. Note the use of < and not == for the check of the timeout. If the impossible were to happen, there is a chance “i” could skip past exactly 1000 and then since this is a 32-bit number, the timeout would be waiting for a long time for the 32-bit number to wrap all the way around. This is another defensive coding technique where in the back of my mind I’m thinking of the impossible and coding to be resilient even when the impossible happens.

3. Default_Handler

Segger has a great article on debugging the many “fault handlers” in the Cortex-M processors. The article provides code for many different handlers to help debug the fault and make the code more resilient.

Default_Handler is in startup_<chipnumber>.c and is unfortunately NOT declared as weak so you must edit the SDK file itself. Best to select the Copy Contents mode in the .slcp file Import Mode. Maybe it’s better to fix in the SDK for all your projects! The Silicon Labs SDK has only a single line while (true); for a default handler. This code counts on the watchdog to eventually reboot the chip. But the reboot isn’t guaranteed and there is no additional debugging information as shown in the Segger examples. All the fault handlers are mapped into this single handler, but they can be individually overridden due to weak assignments. Even something as simple as a divide by zero can cause a fault handler to be called and brick the device.

At a minimum, put the Segger recommended code in for at least some of the exception handlers to make debug easier. Generally, it is a good idea to light an LED (ideally red) or some other external indicator to help during debug. Other ideas are to log the address and condition that caused the exception and store it in the User Data Page/NVM that can be read out from production units that were returned from the field by angry customers. Then perform forensic analysis to identify the cause and release a firmware update that solves the problem.

4. Watchdogs

Watchdog timers are crucial for reliable 24x7x365 operation of an IoT device. A watchdog timer is a timer that slowly counts down. Every now and then, the firmware “feeds” the watchdog by resetting the counter to a high value. If the counter reaches zero, a full reset of the chip is triggered which reboots the chip and hopefully resolves the error condition. The watchdog timer typically takes a couple of seconds of being starved before the reset to ensure it doesn’t falsely reset. The trick to a resilient watchdog is deciding when to feed it, and more importantly, when not to. I wrote a blog post on watchdog timer best practices back in the 500 series days which still applies.

5. Reboot When no Communication for a Day

Hello, is anyone listening? The concept here is basically a long-duration watchdog timer. If the controller hasn’t sent a frame and/or hasn’t acknowledged the receipt of a frame in twenty-four hours, maybe a reboot will clear things up. I’ve seen this in the 500 series where on rare occasions reading the HomeID from the external NVM would fail. As a result, the device would forget the HomeID and assume some random number. This random number would then be stuck in the device for days or weeks or even years until the device rebooted for some reason. This was a classic Impossible Condition that seemed to happen on a fairly regular basis when several tens of thousands of Z-Wave devices have been operating for a few months. The only solution for the end-customer was to rip the bricked device out of the wall! Or more commonly factory reset it and rejoin the network which resulted in one-star reviews.

The solution is simple, setup a 24-hour software timer and check the RX/TX statistics and if nothing has made it through, reboot! Rare impossible conditions are fixed in a way that customers never notice. This check is only needed for always-on or FLiRs (LSEN) devices as deep sleeping devices reboot every time they wake up.

6. Stack Overflow Checking

A real-time-operating-system adds complexity, but FreeRTOS has a feature to check for a stack overflow which is enabled by default. The variable configCHECK_FOR_STACK_OVERFLOW is set to 2 by default in FreeRTOSConfig.h. This enables some checking and fills the stack space with 0xA5s which is then checked with each task switch. Inspecting RAM after running the code for some time in the debugger can provide insights as to how close to overflowing the stack has happened so far. The check calls vApplicationStackOverflowHook if there is a failure but there is only an assert in the weak function. My recommendation is to add a breakpoint here during testing and consider rebooting in the released code. Stack overflow checking is only recommended during development and testing due to the additional overhead.

The insidious problem with stack overflows is they often require several things to go wrong at the same time – a task switch, an interrupt, the radio sending or receiving data and having to find a new mesh route, code allocating sizable temporary buffers and maybe even more code that uses up the limited stack space. As mentioned above, I have observed the stack overflowing, trashing many dozens of memory locations and the code keeps running but eventually there is an impossible condition or more often a hardfault exception. As a result, the failure is often overlooked as it only happened that “one time” but in reality, it happens a lot. Getting the failure to happen repeatedly in a controlled environment is often very difficult. I have had dozens of units set up testing a specific failure case which would take all weekend to finally trigger. Then not having enough data on the unit that failed makes it even more exasperating.

7. Static Code Analysis

Use Claude, CodeX or other static code analysis tools to review all firmware. AI continues to improve at an exponential rate to grade code quality. Often AI can recommend changes to fix the code, but I would carefully check over the suggestions. AI can hallucinate or simply start making things up out of nowhere. The GCC compiler has a -fanalyzer option that will find a few interesting things. Coverity is an industry leader in this field but is pricey. What tools have you used?

Next Steps

Part 6 of the Z-Wave Developer’s Journey discusses hardware best practices. I present my tips and tricks for making low-cost, easy to debug and manufacture Z-Wave products from my 25 plus years of Z-Wave experience. As we continue along the Z-Wave Developer’s Journey, I welcome your comments and questions.  Please feel free to reach out to me directly via email.
A Z-Wave Developer’s Journey | Part 4

Coding and Debugging Z-Wave Firmware

This is an abbreviated version of the full blog on the Z-Wave Alliance website.

Each of the silicon vendors, Silicon Labs and Trident IoT, have their own coding and debugging tools and methods. Each vendor has training on their tools which will help you up the learning curve. In this part of the journey, I present my tips and hints to help you up that steep learning curve. The first step is to watch the training videos or read the getting started guides from each vendor. They are well worth your time. While the videos are not particularly entertaining, you can skip through some parts and watch them at 1.5x which is what I did.

Silicon Labs Simplicity Studio 6

Moving from Simplicity Studio 5 to version 6 requires significant learning as the Integrated Development Environment (IDE) is now based on Microsoft’s Visual Studio Code instead of eclipse. While some parts are familiar, the IDE is markedly different and will take some getting used to. Simplicity Studio 6 (SSv6) is new and has a few wrinkles and rough spots that Silicon Labs will be smoothing out in the coming months. Don’t hesitate to file a case on the support portal or contact your Silabs FAE for help. The first step is to install SSv6 and Visual Studio (VS) Code and the Silabs extension for VS Code. Open SSv6 and you get a broad view of all the wireless protocols Silabs supports, click on Z-Wave to open the list of sample applications. Pick a sample application such as Switch On/Off which is recommended to start with. I recommend using the Copy Contents option. Using the Link SDK and Copy Project Sources option limits VS Code’s ability to find and search through files. The ProjectName.slcp file will open which is where most configuration takes place. The Software Components tab is the doorway to installing command classes or peripheral drivers. Search then install and configure command classes or APIs as needed for your application. The Pin Tool shows a graphical and tabular representation of the GPIOs. The .slpb file is the post-build editor which is where the scripts for keys and OTA file creation are configured but I recommend leaving those at their defaults. Now for the big step – in the upper right corner is the Open in VS Code. Click on that to open the Microsoft tool.

My tips and tricks for using VS Code:

  • Always press to save after editing a file!
    • SSv5 would automatically save when you click on Build, VS Code does NOT
    • It has taken me weeks for this to become a habit. I have been debugging for an hour only to realize the change I made is not in the download because I didn’t hit save
  • Copilot AI is a huge productivity improvement – learn it – use it!
    • Add a comment to any line of code by typing “//” at the end, Copilot usually produces a decent, often wordy, comment on what the code is doing
    • Start typing any function, Copilot fills in the required parameters in the right format(s)
    • Start typing “for”, “while” or “switch”, Copilot fills in much of a likely block of code and as you fill in more code, Copilot guesses what else you need – press TAB to accept the suggestion
    • Copilot hallucinates – it is not perfect so be careful and obviously check the results
  • Searching for variables or functions is different in VS Code than SSv5
    • Hovering will display some information, ask Copilot for more details
    • Right Click opens a popup with many options – recommend Find All References
    • Use the Search menu on the left instead of the bar across the top
      • In Files to Include – add “*.c,*.h” otherwise the search will include object files, .map files and other useless hits
      • Note that the search is across your entire workspace so look carefully at which project the search result is in
    • I sometimes still end up greping to find things
  • Can’t see a file in the Si Extension? Use the Explorer tab (upper left) to see all the files
  • Clean and then Build from scratch if something is not working
  • From the Silabs Extension you can flash firmware, open a terminal, open commander, and other tools
  • The gnudbg debugger is reliable
    • but I still use Segger Ozone when I hit a really squirrely problem
  • Get a new computer with at least 32GB of RAM
    • SSv6 and VSCode are memory hogs
    • I bought a new laptop with an i9 CPU and 32GB which made the experience more efficient and stable

Trident IoT

Trident takes a quite different approach to embedded programming than Silicon Labs. Building a project, compiling and flashing are done using their command line tool called “Elcap”. Elcap relies on Docker or Podman containers to make for a unified development environment regardless of the platform: Windows, Linux or Mac. Trident has a VS Code plugin called “TIDE” which makes for a familiar environment for writing and exploring the embedded code. These features make for frictionless setup as the environment is encapsulated within the container. The container environment also makes support easier as the entire environment can be recreated months or years later and reproduce the identical firmware download. They also claim that upgrading to newer SDK versions will be possible with a single command line. Silabs developers usually must rebuild their entire application starting from a fresh sample application in a newer SDK to upgrade.

Trident IoT Tips and Tricks:

  • Use the latest version of elcap – elcap about
  • elcap self doctor – checks your environment, execute this if something is not working
    • The problem is you usually need to start the Docker Desktop application
  • Append –help to any elcap command for more information
  • Trident relies on the Segger Ozone Debugger
    • VS Code integration with Ozone is expected in a future release. elcap creates a Segger .jdebug file for Ozone as part of the build process
    • In config.cmake set the following so Ozone finds all source code
      • Set(ZWDSK_CONFIG_USE_SOURCES “ON”)
      • Takes a little longer to compile but can single step ALL the code
      • Turn it off again when close to release for faster compile times
  • Use a Segger J-Link to debug your own PCB
    • The connector pinout is NOT the same as the Silabs MiniSimplicity header. The Trident devkit has a J-Link built in but does not debug external PCBs
    • The DKR-HOST can be used to debug trident based PCBs
  • The build environment is based on CMake
    • To configure the project, edit:
      • CMakeLists.txt
      • App/CMakeLists.txt
      • Configuration will be simplified in a future release
  • Complete reference firmware is available on request for several sensor types
  • Start the PCC, Zniffer or Tridents own cross-platform Z-Wave/Zigbee Sniffer from elcap

Next Steps

Part 5 of the Z-Wave Developer’s Journey discusses an often-overlooked schedule hit that in my view is absolutely critical, Firmware Hardening. Developers must keep in mind that IoT devices are often wired to mains power and may run for years without ever rebooting. Thus, the firmware must be resilient to account for impossible conditions that should never happen, but in the real world they often do. Remaining connected to the Z-Wave network and never “bricking” is critical to the success of your product and the reputation of Z-Wave. Do you have some Tips and Tricks to share? Please reach out to me directly via email.

A Z-Wave Developer’s Journey | Part 3

This is an abbreviated version of Part 3, the full article is on the Z-Wave Alliance Web site.

Which Z-Wave Command Classes to Use for Your Z-Wave IoT Device and Why

Command Classes are the key to Z-Wave’s application-level interoperability. All protocols have a standardized physical layer which ensures devices manufactured by different companies can communicate. Z-Wave’s physical layer is defined in the ITU-T G.9959 standard. The physical layer standard is necessary, but insufficient for IoT devices to communicate in a meaningful way. Command Classes are the key to enabling a controller to “know” how to turn on a light when motion is detected and adjust the thermostat to the liking of the user. Command Classes are defined in the Application Work Group Z-Wave Specification available on the Z-Wave Alliance web site.

The “spec” is over 1300 pages long. If you need help sleeping one night, crack this open and you’ll be off to lala land in no time! Fortunately, it is not a document you read from cover to cover. It is more like a dictionary, where you look up specific items to understand exactly how an IoT device communicates in an interoperable way, so all parties properly communicate the information. I make extensive use of the bookmarks bar in the PDF reader to quickly jump to the section I need. Search is also valuable to find the answer to a specific question.

Z-Wave Application Work Group Specification Z-Wave Alliance

When you first open the specification, you’ll see many versions of a command class and numerous ones that are obsolete or deprecated. If a command class is obsolete, you cannot use it ever and as a controller you don’t have to support it. Deprecated command classes are mostly old versions, and you must use the newer ones. Note that it is NOT required to support the latest version of a command class. For example, Battery Command Class version 1 is perfectly fine for most devices. Versions 2 and 3 add extra information for special types of batteries, but version 1 is fine for most IoT devices with simple batteries.

Another key Z-Wave file is the ZW_classcmd.h file which is in the SDK. This file explicitly defines every field of every command in every command class. The spec gets you to the right command, but the ZW_classcmd.h file defines the exact syntax and spelling of the fields you need to put in your code. Fortunately, VS Code does a pretty good job of filling most of this in for you when using Simplicity Studio V6. I’ll go into more coding details in the next blog post.

Where Do I Start?

What’s the first step in coding a new Z-Wave Product? You’ve already chosen the sample app in the 2nd blog and that choice goes a long way toward your first step here. Start with the Device Type V2 Specification section 7. There is a long list of common devices like switches, locks, bulbs, thermostats, sensors, and gateways. Your device should fit into one of these broad categories. Each Device Type specifies a list of mandatory command classes.

Mandatory Command Classes

The sample app typically provides all the mandatory command classes so there is no work required here. But you should double check as requirements change and sometimes the code lags the specification. The Z-Wave Certification Test Tool will do a comprehensive check for all the mandatory command classes so it’s worth a few minutes to check early in the project development.

Mandatory command classes are mandatory for a reason! They significantly improve interoperability! They help make most devices operate in a predictable way and provide similar information. They also ensure your device can be probed for all salient features enabling the hub to offer all your features to the user. This allows your product to be supported the day it starts shipping without waiting for the hub vendor to “support” your product thru manual coding. Note that section 7.2 of the specification has a list of mandatory command classes that are required for all products. These include Z-Wave Plus Info which helps the hub know exactly the general type of device, Association which tells the device where to send unsolicited reports, Firmware Update which enables updates in the field which is now required for the new global security initiatives.

What to do for Command Classes That Haven’t Been Implemented Yet

Not all command classes have been implemented yet. Can AI write them? Probably – let me know if you can create a working command class with AI. None of the thermostat related command classes are in the open-source repository as mentioned above. What do you do? You must implement them yourself. Ideally you should submit your implementation to the open-source repository to help the entire community. This is a pretty high-bar as you must implement every command in the command class and follow the coding rules as well as provide test code to ensure the code is bug-free (maybe bug-lite?). I’m currently implementing Geographic Location and Time command classes which I hope to Pull Request into the repository in the coming months.

The key is to copy a similar command class to use as a starting point. The first step is to implement the REGISTER_CC_V6 macro. Each existing command class has this macro, or an earlier version of it, at the bottom of the main command class file. The macro installs the command class into the Node Information Frame (NIF) and provides links to the command class handlers and other functions. The NIF is the list of command classes the device supports which the hub uses to interrogate the device to learn what it can do when first joined to a network. Next, implement the handlers that decode all the commands of a command class and return a report when a Get command is received. The command to send a frame is zaf_transport_tx() which puts the message into the FreeRTOS queue and sends it to the SDK. A callback function is called when the message is sent with a status of success or not.

Next Steps

Part 4 of the Developer’s Journey will discuss details about coding and debugging Z-Wave firmware. This is a longer blog as there is a lot to cover. I will include several screen shots and recommend tools that I find invaluable. As we continue along the Z-Wave Developer’s Journey, I welcome your comments and questions.  Please feel free to reach out to me directly via email.
A Z-Wave Developer’s Journey | Part 2

This is an abbreviated version of Part 2, the full article is on the Z-Wave Alliance Web site.

Introduction

How do you get started in developing a wireless IoT product using Z-Wave? Assuming you’ve chosen a silicon vendor from Part 1 of this blog, the next step is to become familiar with the tools, developer kits and software of the respective vendors, Silicon Labs and Trident IoT. Both vendors utilize the popular Microsoft Visual Studio (VS) Code Integrated Debug Environment (IDE). Each has developed an extension to customize VS Code for their respective SDK. If you’re not already a VS Code user, you should be. The Intellisense AI feature is a game changer for managing the large amount of code in the SDK you will be interfacing with for your project. I am relatively new to VS Code and I am still in the learning phase. Please comment on this blog If you know of any time saving tricks that I’ll be happy to pass on to the rest of the community.

I highly recommend taking the training and reading documentation from each vendor on using their tools and developers kits. In later postings I’ll be using these tools and assume you are already familiar with them.

Software Architecture, FreeRTOS and the SDK

Fundamentally the Z-Wave SDK relies on the open-source FreeRTOS real time operating system. FreeRTOS provides many resources such as multitasking, software timers, memory management and security.  The Z-Wave SDK is in one task, your application code is in another task and then there are a few utility tasks. The use of an RTOS makes the code more modular but also more complex. Instead of simply calling a function to send a message over the radio, the application task sends the message through a queue to the Z-Wave task which then sends it over the radio and later returns the result to a callback function you passed through the queue. When the RTOS determines there’s nothing to do, it will put the chip to sleep. An always-on device will only put the CPU to sleep and leave the radio on, but battery powered devices will go into a low power mode.

Each vendor has some amount of the SDK pre-compiled into a library. Mostly this provides an abstraction layer that gives the vendor a level of intellectual property protection. Much of the code is in source code form and you will compile the SDK with your code as well. Trident has a method to compile all the source code into your project which can make debugging the SDK possible. The SDK includes lots of helper APIs and code for many common command classes. If the command class you need is not available (yet), you will want to copy the code of a similar command class. To be efficient, you need to reuse as much code as possible. Gotta love copy and paste.

What to Customize Next

Below is a list of things I customize for any new project. I’m using the Silicon Labs SDK in this case but Trident is similar and starts by editing the app/CMakeLists.txt file. Open the .slcp file in Simplicity Studio V6, click on Software Components, then Installed, then open the Z-Wave list.

  1. Z-Wave Core Component – Select the Z-Wave Region to match your location
    1. Max Tx Power will need customization when preparing for regulatory approval
  2. Z-Wave Version Numbers – Turn on (True) Use Application Version and enter version numbers
    1. The Minor Version MUST be incremented for OTA firmware update
  3. Z-Wave ZAF Component – Several items must be customized for your product
    1. The Manufacturer Specific ID, Product Type and Product ID are a 48-bit unique identifier for the product – basically a fingerprint
  4. Command Classes – Association CC – Recommend a single Lifeline NodeID
  5. Uncheck Installed – then install Z-Wave Debug
    1. This will uninstall Z-Wave Release which uses higher compiler optimization and the debugger is unable to accurately single step C source code
    1. Note that OTA fails when DEBUG is enabled due to code size with the lower optimization
  6. Z-Wave Log – optionally turn on more logging which will print more messages out the UART
    1. Entering vcom into all 4 debug levels will print a lot of messages
    1. Be sure to turn this OFF when getting close to a release
    1. Note that the sending text out the UART is a blocking operation and will change how the code runs and may cause a watchdog reset

These customizations are just the start! From here you will install other command classes, SPI, I2C or UART drivers and of course your own custom code.

See more details at the full blog posting on the Alliance Web Site via this link: https://z-wavealliance.org/a-z-wave-developers-journey-part-2-2/

Please comment below on this or any of the topics in the Developers Journey.


Join me at the Z-Wave Summit May 27-29 in Vienna Austria. Unplug Fest is the afternoon of the 27th which I will be coordinating. We’re not doing range testing this time around but will be demonstrating some of the main features of Z-Wave including SmartStart, Multicast, Mesh routing and more. Bring your new devices and test them with several ecosystem players to see Z-Wave interoperability in the real world.

A Z-Wave Developers Journey | Part 1

The Z-Wave Alliance is funding my writing of a blog that describes how to develop a Z-Wave product. The “Journey” is a series of ten blog postings with step-by-step descriptions of how to develop a Z-Wave product from idea to volume production. The full blog posting is on the Alliance web site but here is an abbreviated version.

Introduction

A Z-Wave Developer’s Journey is a series of ten blogs on the nuts and bolts of creating and bringing to market a wireless IoT product utilizing Z-Wave. The series provides a step-by-step roadmap for an engineering team to bring their idea from the concept to a product ready for volume manufacturing. Naturally, this series can’t delve into every aspect of the process but leverages vendor training, documentation and Github to flesh out the details. The journey focuses on Z-Wave end devices but a similar process would be followed by Z-Wave controllers. One thing to note is that everything is constantly changing. The Z-Wave specification continues to evolve with new Command Classes and updates to existing ones, the vendor Software Development Kits (SDKs) have new releases every few months and new silicon chips are always being released. While the guidance shared here is relevant today, details will inevitably evolve over time, so stay engaged and enjoy the ride.

Topics

The journey begins with this blog which describes the topics to be discussed in this ten-part series. You have the opportunity to comment on these topics as each is published. Feel free to comment or reach out to me directly at DrZWave@DrZWave.blog. I continue to learn by doing and enjoy exchanging best-in-class techniques for IoT product development of both hardware and software even in “retirement”. Below is a list of planned topics though the list may morph somewhat along the way based on your feedback. Don’t be shy, comment below or send me an email.

  1. Introduction & Z-Wave Silicon Choices
  2. First Steps in Customizing Z-Wave Firmware
  3. Which Z-Wave Command Classes to Include and Why
  4. Coding and Debugging Z-Wave Firmware
  5. Firmware Hardening
  6. Z-Wave Hardware Design Best Practices
  7. Optimizing Battery Life
  8. Antennas for Z-Wave
  9. Z-Wave Regulatory Process
  10. Z-Wave Volume Manufacturing

See the Alliance blog posting for details on the available Z-Wave silicon.

How to Choose

Which Z-Wave chip should you use for your project? Of course, the answer is… depends. The main challenge with the ZG23 is the limited amount of flash and RAM. The SDK uses virtually all the available resources. If your product is fairly simple, like a door/window sensor, the ZG23 should be fine. If you are designing a thermostat or door lock, I would recommend either the ZG28 or the CZ20. If you use the Silicon Labs QFN48 you can develop using the ZG28 and then potentially reduce cost by switching to the pin compatible ZG23 if the code fits. The ZG23 could also work out if you connect an external serial flash chip for the OTA image. That frees up half of the 512KB of flash for your application but it’s still tight on RAM. The ZGM230 module is easier to manufacture since the crystal is calibrated at the factory but is limited to +14dBm transmit power thus effectively cutting the RF range in half. The choice of Silicon Labs or Trident IoT is a more nuanced choice based on the support and relationship you have with the vendor.

Feel free to comment below or contact me with your thoughts or topics you need answers!

Save the DATE! EMEA Z-Wave Unplug Fest and Summit Vienna, Austria, May 27-29.

Dreaded Flash Memory Overflow Solutions

The EFR32ZG23 Z-Wave 800 series MCU has limited FLASH and RAM available for the application. The 800 series actually has less FLASH than the 700 series which stored the bootloader in a dedicated 16K memory. Worse, the bootloader in the 800 series has grown from 16K to 24K! Features are always being added to the SDK making it ever larger leaving less for the application. Seems like Silicon Labs needs to spend some time squeezing the code instead of constantly adding features.

Here is the typical error message when FLASH overflows:

Description	
FLASH memory overflowed !	
make: *** [makefile:114: all] Error 2
make[1]: *** [makefile:123: SwOnOff_2024120_ZG23B_GeoLoc.axf] Error 1
region `FLASH' overflowed by 92 bytes
SwOnOff_2024120_ZG23B_GeoLoc.axf section `.nvm' will not fit in region `FLASH'

We can’t create more FLASH on the chip, it has what it has. But, there’s always software we can change! By default, the project has ZAF->Z-Wave Release installed which sets the C compiler optimization to -Os which optimizes for size which is probably what we want since we’re out of FLASH. However, deep in the configuration files there is the definition for SL_BOOTLOADER_STORAGE_SIZE which changes from 196K to 180Kbytes when NDEBUG is defined. NDEBUG is defined when the Z-Wave->ZAF->Z-Wave Debug component is installed. The question of why BOOTLOADER size is being reduced by only 16K when debug is enabled is unclear to me. However, in my testing, adding the DEBUG component still results in FLASH overflowing but now by 4344 bytes! Obviously the change in Optimization from -Os to -Og (debugging) blew up the code which is expected. I enabled DEBUGPRINT to get debugging information out the UART which increased the flash usage even more.

Since I am debugging and will not be testing OTA at this stage, I don’t care how big the bootloader storage size is since I am not using it. I need more FLASH space for debugging! Simply edit the sl_storage_config.h file and change SL_BOOTLOADER_STORAGE_SIZE from 0x2C000 to 0x20000 to free up another 48K bytes:

// <o SL_BOOTLOADER_STORAGE_SIZE> Size of the bootloader storage.
// <i> Default: 0x20000
// <i> Note that this value is only being used if BOOTLOADER_STORAGE_USE_DEFAULT
// <i> is set to false. This value will control how much of the flash memory
// <i> is reserved for bootloader storage.
#if defined(NDEBUG)
#define SL_BOOTLOADER_STORAGE_SIZE  0x00030000
#else /* defined(NDEBUG) */
//#define SL_BOOTLOADER_STORAGE_SIZE  0x0002C000    - original value
#define SL_BOOTLOADER_STORAGE_SIZE  0x00020000
#endif /* defined(NDEBUG) */

Now the project fits comfortably in FLASH with plenty of left over space. However, I cannot OTA it and definitely cannot ship it in this way for production. Once I’m done debugging, I’ll have to revert back to RELEASE mode and remove DEBUGPRINT. If FLASH is overflowing that will require some additional effort to squeeze back into the available space. I would first try Link-Time-Optimization (-flto) to the C compiler but that can introduce some instability and require significant amounts of testing time. Next, try looking for code you don’t need and remove it. After that, complain to Silicon Labs they need to shrink their code!

Ram usage       :    65532 /    65532 B (100.00 %)
Flash usage     :   446868 /   491520 B ( 90.92 %)

RAM usage is at 100% is OK because the HEAP is expanded to fill the available space. But there is very little left over for the application as any RAM usage is making the HEAP smaller. The HEAP is used for all sorts of things like temporary variables, buffers and FreeRTOS. I am very concerned that some of the bugs in Z-Wave products are due to heap overflows. Heap overflows are very difficult to reproduce and debug as they typically require several failures to happen at just the right time. Unfortunately these failures seem to happen with regularity in the real world.

Hope this helps you get back to debugging quickly. Leave me a comment below with your helpful hints that I can include in a future post.

Geographic Location Command Class – GPS Coordinates to the Centimeter

Z-Wavre Long Range Heat Map

First Pass is Rarely Perfect

Geographic Location Command Class was introduced around 2014 but it appears no one ever implemented it. How do I know no one implemented it you ask? Because version 1 is not particularly useful. I asked the Z-Wave Certification manager to search the certified database and no product has ever claimed support for it. The problem with V1 is that the 16-bit coordinates limit the resolution to about two kilometers. Two kilometers is sufficient to determine the time for sunrise or sunset, but not to locate a device within a home or yard. With the arrival of Z-Wave Long Range where devices could be placed in an area as large as twelve square miles, we need a way for the device to store and report its location within a few meters or less. Thus, while the first pass (version 1) has some usefulness, with new technology (ZWLR) we have new needs and thus there is a need for a new version of Geographic Location CC. Updating a command class demonstrates the living document nature of the Z-Wave specification and how you and I can add new features to the standard!

Resolution of a Location on the Earth

The circumference of the earth is about 40,075,000 meters. There are 360 degrees of longitude so each degree is 111,319 meters. The earth isn’t a perfect spheroid but for our purposes, a sphere is close enough. In embedded systems with limited resources, we need to represent the latitude/longitude with enough bits for sufficient accuracy to meet our needs. I propose a resolution of approximately one centimeter which is certainly more than enough and currently beyond the resolution of todays (but not tomorrows) low-cost GPS receivers.

The current Z-Wave Geographic Location Command Class V1 uses 1 bit for the sign, 8 bits for the Degrees and 7 bits for the Minutes. Since the 7 bits are in minutes instead of a fraction of a degree, the 7-bit value only ranges from 0-60 which means there are actually less than 6 bits of resolution. Thus, the resolution of the current V1 is 111319m/60=1.855km. Two kilometers of resolution isn’t enough to locate a device within a single Z-Wave network.

How many bits are needed for 1 centimeter resolution?

Degree Fraction BitsResolutionComments
0111,319m1 degree=111km
155,6560m
227,830m
3 … 16Each bit doubles the resolution
170.85m
180.42m
190.21m
200.11m
210.05m
220.03m
230.01mCentimeter resolution
GPS Coordinate Degree Fraction Bits of Resolution

The proposal is to update Geographic Location CC to V2 and make the values 32-bits to achieve roughly 1 centimeter resolution. Using only fractional degrees gives more resolution with fewer bits and is easier to compute. We need 8 bits to represent Longitude from 0 to 180 plus the sign bit for a total of 9 bits. Then another 23 bits for the fraction. Version 1 has the sign bit in the Minutes field which doesn’t make for an easy number to manipulate. We have to bit-swizzle the sign and then divide minutes by 60 to get the fraction. The proposal for V2 is a simple fixed-point fraction as shown below:

Geographic Location SET

76543210
Command Class = COMMAND_CLASS_GEOGRAPHIC_LOCATION (0x8C)
Command = GEOGRAPHIC_LOCATION_SET (0x01)
Lo SignLongitude Degree Integer[7:1]
Lo[0]Long Fraction[22:16]
Longitude Fraction[15:8]
Longitude Fraction[7:0]
La SignLatitude Degree Integer[7:1]
La[0]Lat Fraction[22:16]
Latitude Fraction[15:8]
Latitude Fraction[7:0]
Altitude[23:16] MSB
Altitude[15:8]
Altitude[7:0] LSB
Geographic Location CC V2 proposal

Longitude/Latitude

Longitude and Latitude formats are the same with a sign bit, 8 bits of integer Degree and 23 bits of fraction. The values are signed Degrees which for longitude varies from -180 to +180 and for latitude varies from -90 to +90. The rest of the bits are a fraction of a degree which yields roughly centimeter resolution.

Altitude

Altitude is a twos-complement signed 24 bit integer which yields a maximum of 83km in centimeters (more than enough!) to as much as -6,000km which is the radius of the earth. Note that altitude can be negative as the altitude is relative to sea level. Most GPS receivers will provide altitude so why not include it here in the Z-Wave standard? We need altitude because ZWLR devices could be spaced out vertically as well as horizontally.

Geographic Location GET

Geographic Location GET is the same as the existing V1.

76543210
Command Class = COMMAND_CLASS_GEOGRAPHIC_LOCATION (0x8C)
Command = GEOGRAPHIC_LOCATION_Get (0x02)

Geographic Location REPORT

76543210
Command Class = COMMAND_CLASS_GEOGRAPHIC_LOCATION (0x8C)
Command = GEOGRAPHIC_LOCATION_REPORT (0x03)
Lon SignLongitude Integer[7:1]
Lon Int[0]Long Fraction[22:16]
Longitude Fraction[15:8]
Longitude Fraction[7:0]
Lat SignLatitude Integer[7:1]
Lat Int[0]Lat Fraction[22:16]
Latitude Fraction[15:8]
Latitude Fraction[7:0]
Altitude[23:16] MSB
Altitude[15:8]
Altitude[7:0] LSB
QualROAl ValidLa ValidLo Valid
REPORT is the same as SET with the additional STATUS byte

Status Byte

The additional Status byte provides additional information about the long/lat/alt values:

Qual: From the NMEA GPS Quality Indicator: GPS receivers need a minimum of four satellites to compute the location. Thus, QUAL is the number of satellites used for the most recent computation. If more than 15 satellites are used, then the value is clamped to 15. The values 0-3 are reserved for debugging.

RO: Read Only – Long/Lat/Alt are Read-Only when set to 1. Devices with GPS receivers set this bit to indicate that the values are from an on-board sensor. SET commands are ignored. Devices without a GPS receiver clear this bit to zero and will have their location set at commissioning time typically using a phone to set the GPS coordinates.

Al Valid: The Altitude value is valid when set to 1. When cleared to 0, the Altitude value is unknown and MUST be ignored.

La & Lo Valid: Each bit signifies when the Latitude and Longitude values are valid. When cleared to zero, the Latitude or Longitude MUST be ignored.

If a SET command was sent, the Longitude, Latitude and Altitude is then considered valid and is retained thru a power cycle but will be cleared if excluded or factory reset.

GPS Receiver to Geographic Location Conversion

All GPS receivers use the NMEA 0183 standard for reporting the coordinates. The string of ASCII characters for longitude and latitude is defined to be [D]DDMM.MMM[M] where D is decimal degrees and M are the miutes. The MM.MMMM value must be divided by 60 to convert minutes into fractions of a degree.

A typical NMEA sentence looks like:

$GPGGA,134658.00,5106.9792,N,11402.3003,W,2,09,1.0,1048.47,M,-16.27,M,08,AAAA*60

Text color matches the field: Latitude, Longitude, altitude – see the details via the NMEA link above.

Converting the values in Geographic Location CC to decimal is accomplished using code similar to: const longitude=payload.readInt32BE(0) / (1 << 23);

GitHub Repo

An implementation of the Geographic Location CC V2 is at: https://github.com/drzwave/GeographicLocationCC

The repository implements Geographic Location CC in an end-device such as the Z-Wave Alliance ZRAD project or on a Silicon Labs Devkit using a QWIIC I2C based GPS receiver like the M8Q from Sparkfun.

See the repo for more examples and details. The official Z-Wave Alliance specification update with GeoLocV2 is currently being reviewed and expected to be published in one of the 2025 releases.

Heat Map Examples

One of the drivers to create GeoLocV2 is to generate heat maps of the RF Range for testing Z-Wave Long Range. In previous Unplugfests we use a very subjective measurement of having an LED stop blinking when out of range. Often the LED would pause, but then start blinking again, then stop so it was difficult to determine the exact edge of RF range. With GeoLocV2 we can map the exact locations where the device is when it is able to make 100% error free, encrypted connection.

The Silicon Labs Works With 2024 conference produced a fantastic video (featuring DrZWave! – well, I have a supporting role) demonstrating GeoLocV2 in action on a motorcycle! Skip to minute 43:40 (about 3/4 of the way thru the video) to see the video.

Z-Wave Long Range demonstration video from Silicon Labs Works With 2024 using Geographic Location Version 2

Below is a heat map from a skydiving test that we will be producing a video in the near future. Z-Wave Long Range demonstrated 2.7 mile range – straight UP! A ZRAD was used as the controller running Z-Wave JS and a small Javascript program to extract the GeoLoc data from a commercial Z-Wave device using a PCB antenna stuffed inside a fanny pack of the jumper. This example demonstrates the need for the Altitude in the specification.

Below is a heat map with the color showing the transmit power needed to make an error free connection which ranges from -6dBm to +20dBm. The test took place in a residential neighborhood outside Boston Massachusetts where the ZRAD controller is in a wood frame building on the second floor and a ZRAD End Device was driven around the neighborhood reaching a general 500m and a maximum of over 1.4km. This demonstrates the dynamic power of Z-Wave Long Range where it saves battery power anywhere within 100 meters but can extend the range thru many obstacles to over a kilometer.

Be sure to attend the upcoming Z-Wave Unplugfest and Summit in Barcelona Spain in February 2025 or the one in Carlsbad CA in April to see GeoLocV2 in action.

Make Your Own Z-Wave Device

Have you always wanted your very own Z-Wave widget-thing-a-ma-bob-doohickey? Silicon Labs recently released the Thunderboard Z-Wave (TBZ) which is an ideal platform for building your own Z-Wave device. Officially known as the ZGM230-DK2603A, the TBZ has sensors galore, expansion headers to connect even more stuff, comes with a built-in debugger via USB-C and can be powered with a single coin cell. Totally cool! I am working on a github repo for the TBZ but right now there are three simple sample apps in Simplicity Studio to get started.

ThunderBoard Z-Wave

Thunderboard Z-Wave

Features

  1. ZGM230 Z-Wave Long Range Module – +14dBm radio – 1mi LOS RF range
    1. ARM Cortex-M33, 512/64K FLASH/RAM, UARTs, I2C, SPI, Timers, DAC/ADC and more
  2. Built-in Segger J-Link debugger
  3. USB-C connectivity for SerialAPI and/or debugging
  4. RGB LED, 2 yellow LEDs, 2 pushbuttons
  5. Temperature/Humidity sensor
  6. Hall Effect sensor
  7. Ambient Light sensor
  8. 6-Axis Inertial sensor
  9. Metal sensor
  10. 1Mbyte SPI FLASH
  11. Qwiic I2C connector
  12. Break-out holes
  13. SMA connector for antenna
  14. Coin cell, USB or external power
  15. Firmware development support via Simplicity Studio

Sample Applications

There are three sample applications in Simplicity Studio at the time of this writing (Aug 2022 – SDK 7.18.1);

  1. SerialAPI,
  2. SwitchOnOff
  3. SensorMultilevel

The TBZ ships with the SerialAPI pre-programmed into it so you can use it as a Z-Wave controller right out of the box. Connect the TBZ to a Raspberry Pi or other computer to build a Z-Wave network. Use the Unify SDK to get a host controller up and running quickly or use the PC-Controller tool within Simplicity Studio for development and testing. The SwitchOnOff sample app as the name implies simply turns an LED on/off on the board via Z-Wave. This is the best application to get started as the ZGM230 chip is always awake and is easy to debug and try out. The SensorMultilevel sounds like a great app as it returns a temperature and humidity but at the moment it does not use the sensor on the TBZ and simply always returns a fixed value. SensorMultilevel shows how to develop a coin-cell powered device. Additional sample apps are expected to be available in future SDK releases but I am working on a github repo with a lot of sensor support.

Naturally a single Z-Wave Node doesn’t do much without a network. You’ll need some sort of a hub to connect to. Most of the common hubs (SmartThings, Hubitat, Home Assistant, etc) will at least let you join your widget to the network and do some basic control or status reporting. You need either a pair of TBZs or perhaps purchase the even cheaper UZB7 for the controller side and then the TBZ for the end-device. Then you have a network and can build your doohickey and talk to it over the Z-Wave radio.

Getting Started

Plug in the TBZ to your computer and open Simplicity Studio which will give you a list of applicable documents including the TBZ User Guide. Writing code for the TBZ definitely requires strong C programming skills. This is not a kit for an average Z-Wave user without strong programming skills. There is a steep learning curve to learn how to use the Z-Wave Application Firmware (ZAF) so only experienced programmers should take this on. I would recommend watching the Unboxing the 800 series video on the silabs web site to get started using Simplicity Studio. I hope to make a new video on the TBZ and publish the github repo so stay tuned.

Have you created a Thing-a-ma-bob using the TBZ? Let me know in the comments below!

Z-Wave 800 GPIO Decoder Ring

The two Z-Wave 800 series chips from Silicon Labs have flexible GPIOs but figuring out which one is the best for which function can be challenging. There are a number of restrictions based on the function and the energy (sleep) mode you need the GPIO to operate in. Similar to my posting on the 700 series, this post will guide you to make wise decisions on which pin to use for which function.

The tables below are a compilation of several reference documents but all of the data here was manually copied out of the documents and I could have made a mistake or two. Please post a comment if you see something wrong and I’ll fix it right away.

Reference Documents

  • EFR32xG23 Z-Wave 800 SoC Family Datasheet
  • ZGM230 Z-Wave 800 Module Datasheet
  • EFR32xG23 Reference Manual
  • WSTK2 Schematic (available via Simplicity Studio)
  • BRD4210 EFR32ZG23 Radio Board +20dBm Schematic
  • Thunderboard Z-Wave UG532 and Schematic

Pin Definitions

The table below lists the pins from the most flexible to the most fixed function. There are more alternate functions than the ones listed in this table. The most commonly used alternate functions are listed here to keep the table readable. Refer to the schematics and datasheets for more details.

Port A and B are operational down to EM2, other GPIOs will retain their state but will not switch or pass inputs. Thus, use port A and B for anything special and use C and D for simple things not needed when sleeping (LEDs, enables, etc).

WSTK GPIO Probe Points

Only the ZG23 QFN48 pin numbers are listed in the table. The QFN48 is expected to be pin compatible with future version of the ZG23 with additional Flash/RAM so I recommend using it over the QFN40. The WSTK2 is the Pro DevKit board with the LCD on it which comes as part of the PK800 kit. There are two sets of holes labeled with Pxx numbers on them which are handy to probe with an oscilloscope. The Thunderboard Z-Wave (TBZ) also has 2 rows of holes which are ideal for probing or connecting to external devices for rapid prototyping.

NameZG23ZGM230WSTK2TBZALT
FUNC
Comments
PB2229P19EXP5
BTN1
Use the pins at the top of this list first as they are the most flexible
PB6NA5EXP15
I2CSDA
TBZ Qwiic I2C_SDA
PB5NA6EXP16
I2CSCL
TBZ Qwiic I2C_SCL
PB4NA7
PA103523
PC1235P1EXP4PC and PD are static in EM2/3
PC2336P3EXP6
PC3437P5EXP8
PC4538P35BLUE
PC6740P33EXP9
PC8942P31LED0
PC91043P37LED1
PD34530P26IMUEN
PB02411P15VDAC0CH0
PA02512P2GREENIDACVREF
PB12310P17REDEM4WU3
VDAC0CH1
EM4WUx pins can wake up from EM4 sleep mode on a transition of the GPIO
PB3218P21EXP3
BTN0
EM4WU4
PC0134P7EXP10EM4WU6
PC5639P12EXP7EM4WU7
PC7841P13SNSENEM4WU8
PD24631P6EXP11EM4WU9
PD0_LFXTAL_O4833XC32XC32BRD4210 and TBZ have 32KHz crystal mounted
PD1_LFXTAL_I4732XC32XC32Accurate timing while sleeping – Time CC
PA73220P10TraceD3Trace pins for debug & code coverage
PA63119P8TraceD2Trace is configurable for 4, 2 or 1 data pin
PA53017P4IMUINTEM4WU0
TraceD1
PA4_TDI2916P41EXP13JTAG_TDI
TraceCLK
JTAG data in
Trace Clock out
Pins below here should be used primarily for debug
PD4_PTIDATA4429P25Packet Trace Interface (PTI) data
PD5_PTISYNC4328P24EM4WU10PTI Sync
PA9_URX3422P11EXP14VCOM UART
PA8_UTX3321P9EXP12VCOM UART
PA3_SWO2815P16JTAG_TDO
TraceD0
RTT UART printf and Trace D0
PA2_SWDIO2714P18JTAG_TMSThese two SWD pins should ONLY be used for debug and programming
PA1_SWCLK2613P20JTAG_TCKSWD debug clock
Pins below here are fixed function only
SUBG_O118NANot used by Z-Wave
SUBG_I116NANot used by Z-Wave
SUBG_O0193RFIO on ZGM230
SUBG_I017NAMatching network to SMA
RESET_N131F4Push buttons on DevKit boards
HFXTAL_O12NA39MHz crystal
HFXTAL_I11NA39MHz crystal
DECOUPLE36181.0uF X8L cap (unconnected on ZGM230)
VREGSW37NAInductor to DVDD for DCDC – 3.3V
VREGVDD38253.3V In/Out based on mode
DVDD4024VDCDC on ZGM230
AVDD41NAHighest voltage – typically battery voltage
IOVDD42261.8-3.8V
PAVDD20NA3.3V for +20, 1.8V for +14dBm
RFVDD14NA1.8V or 3.3V but less than PAVDD
VREGVSS3927, 44GND
RFVSS152, 4GND

Power Supply Pins

Obviously the power supply pins are fixed function pins. The only really configurable parts to this set of pins is the voltage to apply to the IOVDD, AVDD and whether to use the on-chip DC to DC converter or not. If your device is battery powered, AVDD should be the battery voltage assuming the battery is nominally 3V (coin cells or CR123A). AVDD can be measured by the IADC in a divide by 4 mode to give an accurate voltage reading of the battery. This avoids using GPIOs and resistor dividers to measure the battery level thereby freeing up GPIOs and reducing battery drain. IOVDD should be set to whatever voltage needed by other chips on the board. Typically either 1.8 or 3.3V. The DCDC should be used in most battery powered applications unless a larger DCDC is present on the board already to power other chips.

The other configurable voltage is the RFVDD and PAVDD and the choice there depends on the radio Transmit Power you wish to use. For +14dBm PA an RF VDD are typically 1.8V. For +20dBm PAVDD must be 3.3V.

Every product has unique requirements and sources of power so I can’t enumerate all possible combinations here but follow the recommendations in the datasheets carefully. Copy the radio board or Thunderboard example schematics for most typical applications.

Debug, PTI and Trace Pins

The two Serial Wire Debug (SWD) pins (SWCLK and SWDIO) are necessary to program the chip FLASH and are the minimum required to be able to debug firmware. While it is possible to use these pins for other simple purposes like LEDs, it is best if they are used exclusively for programming/debug. These should be connected to a MiniSimplicity or other debug header.

The SWO debug pin is the next most valuable pin which can be used for debug printfs in the firmware and output to a debugging terminal. Alternatively, the UART TX and RX pins can also be used for debugging with both simple printfs and able to control the firmware using the receive side of the UART to send commands.

The two Packet Trace Interface (PTI) pins provide a “sniffer” feature for the radio. These pins are read by Simplicity Studios Network Analyzer to give a detailed view of all traffic both out of and into the radio. The main advantage of these pins is that they are exactly the received data by the radio. The Z-Wave Zniffer can also be used as a standalone sniffer thereby freeing these pins for any use. The standalone Zniffer however does not show you exactly the same traffic that the PTI pins do especially in noisy or marginal RF conditions. Thus, the PTI pins on the device provide a more accurate view of the traffic to the device under test.

The Trace pins provide additional levels of debug using the Segger J-Trace tool. These pins output compressed data that the debugger can interpret to track the exact program flow of a running program in real time. This level of debug is invaluable for debugging exceptions, interrupts, multi-tasking RTOS threads as well as tracking code coverage to ensure all firmware has been tested. Often these pins are used for other purposes that would not be necessary during firmware debug and testing. Typically LEDs or push buttons can be bypassed during trace debug. There are options to use either 4, 2 or even 1 trace data pin but each reduction in pins cuts the bandwidth and make debugging less reliable.

LFXO and EM4WU Pins

The Low Frequency Crystal Oscillator (LFXO) pins are typically connected to a 32KHz crystal to enable accurate time keeping within several seconds per day. If supporting the Time Command Class, I strongly suggest adding the 32KHz crystal. While you can rely on the LFRCO for time keeping, it can drift by as much as a minute per hour. While you can constantly get updated accurate time from the Hub every now and then, that wastes Z-Wave bandwidth and battery power. Both the Thunderboard and BRD4210 include a 32KHz crystal so you can easily compare the accuracy of each method.

Reserve the EM4WU pins for functions that need to wake the EFR32 from EM4 sleep mode. These are the ONLY pins that can wake from EM4! Note that ports PC and PD are NOT able to switch or input from peripherals while in EM2. See the datasheet and reference manual for more details.

Remaining GPIOs

Many of the remaining GPIOs have alternate functions too numerous for me to mention here. Refer to the datasheet for more details. Most GPIOs can have any of the digital functions routed to them via the PRS. Thus, I2C, SPI, UARTs, Timers and Counters can generally be connected to almost any GPIO but there are some limitations. Analog functions have some flexibility via the ABUS but certain pins are reserved for special functions. Hopefully these tables help you make wise choices about which pin to use for which function on your next Z-Wave product.

Tiny Headers for Reliable Debug

Here we go again… Once again I’ve been given yet another board with randomly placed test points instead of a nice neat, reliable header to connect via my MiniSimplicity cable. So I’m spending an hour on my microscope soldering thin little wires to the tiny little test points to be able to flash and then debug the firmware on a new ZG23 based product. Once I’m done soldering, I’m left with a very fragile board which is unreliable at best and at worst will result in even less hair on my thinning head. My post from 2019 described using a zero cost header for a reliable connection, but it seems not everyone is reading my blog!

On the flip side, a different customer sent me their board with a Tag-Connect Edge-Connect that I had not seen before but is absolutely brilliant. The Edge-Connect uses the EDGE of your PCB for the test points. Barely 1mm wide and about 20mm long it is possible to include this debug connector on virtually any PCB. There is a locking pin to hold the cable secure while the spring loaded tabs press into the castellated notches to ensure solid contact.

Close up of the locking pin and castellated notches

There are several sizes of the Edge-Connect but the recommended one is the 10-pin EC10-IDC-050 which matches the MiniSimplicity header on the WSTK DevKit board. Note that the the 6pin cable in the photo above is NOT the one I would recommend but it was the only one in stock at the time and it worked fine for debugging but doesn’t have the UART or PTI pins.

Tag-Connect has many other types of debug headers/cables of various configurations to hold the cable to the PCB securely. The original Tag-Connect cables have plastic clips that snap into fairly large thru-holes in your PCB. While this is a reliable connection, the thru-holes eat up a lot of PCB real estate. The next evolution was to use a small retaining clip under the PCB that grips onto the metal alignment pins. The photo below shows the PCB pads are not much bigger than an 0805 footprint and only requires three small thru-holes.

Note the smallest header is about the same as an 0805 in lower left corner

The lowest cost approach is to simply add a 10-pin header footprint on your PCB that matches the pinout of the MiniSimplicity header. See section 5.1.1 of Application Node AN958 for the pinout of the 10-pin MiniSimplicity header. You don’t need to solder the header onto the PCB except when debugging. Thus the header can be under a battery or some relatively inaccessible location as when you are debugging in the lab the PCB is usually not installed in the product enclosure.

Please use ANY of these standard connectors on your next project. Without a solid connection between your computer and the chip you will find yourself chasing ghosts and losing hair.