One of the most common questions in embedded programming is “How much FLASH/RAM am I using?” or more precisely, “How much do I have left before I run out?” or even “How much do I have to squeeze my code to fit in the available space?” Yikes! Very often the code size quickly fills to fit the available space and then you start struggling to fit all the features in your product. This problem afflicts the Z-Wave 700 series just as much as any other IoT development. I’ll give you a few hints on tools to measure the code size and figure out where the bloat is and options to squeeze a little more code in.
ZGM130S Resources
The first step is to understand how much FLASH/RAM we have in the Z-Wave ZGM130S. Open the datasheet and we see there is 512K FLASH and 64K RAM. Seems like a TON! But wait, a closer look at the datasheet and there is a note that only 64KB FLASH is available for the application and 8KB RAM. That’s not a lot for a complex IoT device like a thermostat with an OLED screen but is plenty for a simple on/off light switch. Like any engineering trade off, the chip balances the available resources to match the most common use cases.
The Z-Wave stack isn’t huge so fortunately there is sufficient space available for most applications. However, the stack developers have reserved most of the the FLASH and RAM space for future upgrades. There is no easy to use tool that precisely measures how much code space is being used for the stack versus the application. In this post I’ll give you some tools to see how close you are to the total and then subtract a typical sample application size to find the amount your application is using. INS14259 section 5.1 gives the typical FLASH usage for the Z-Wave sample applications.
Half of FLASH (256K) is reserved for the Over-The-Air (OTA) firmware image. This block of flash is used when the firmware is updated and the data is stored here temporarily until the signature is checked and the code can be decrypted. Once that test has passed then the code is copied down into the normal FLASH space and the chip reboots into the new firmware version. If you need a lot more than 64K of FLASH you can consider moving the OTA storage from the upper half of the ZGM130S to an external serial FLASH. This is supported in the Silicon Labs Gecko Bootloader but requires some coding to free up all that space. This also requires hardware support for the external FLASH chip. So if you think you’re going to be short on code space, I highly recommend adding a serial FLASH chip even if you don’t use it right away. I plan to describe the OTA to external FLASH process in a future blog posting so stay tuned.
ARM Tools
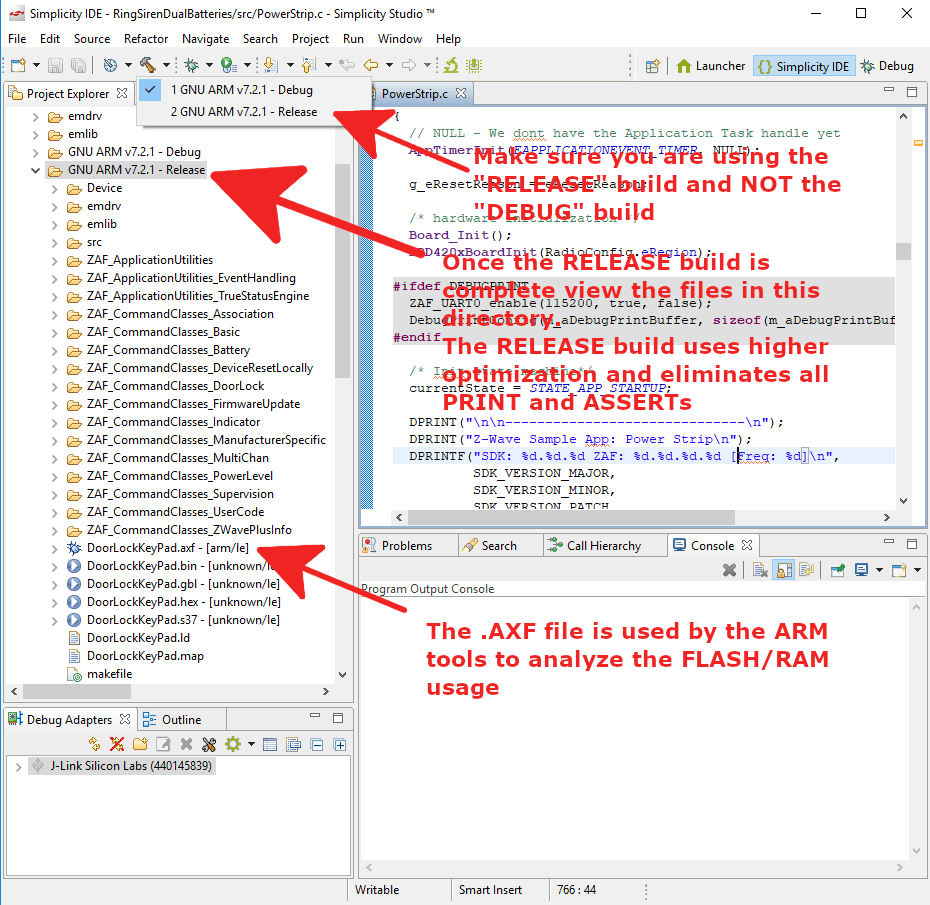
Before starting with code size analysis be sure you are working with the “release” build and not the debug build. Click on Project->Build Configurations->Set Active and select the Release build. Then build the project. The debug build uses minimal optimization and has tons of ASSERT and PRINTF code in it which invalidates the code size analysis.
ARM eabi-size
When you compile a Z-Wave project it will run the arm-none-eabi-size -A <project.axf> command which prints out an obscure listing of the sizes of various FLASH segments. The DoorLockKeyPad sample application produces the following:
DoorLockKeyPad.axf  :
section             size        addr
.nvm3App           12288      475136
.simee             36864      487424
.text             168760           0
_cc_handlers         120      168760
.ARM.exidx             8      168880
.data               1132   536870916
.bss               28956   536872048
.heap               3072   536901008
.stack_dummy        1024   536901008
.ARM.attributes       46           0
.comment             126           0
.reset_info            4   536870912
.debug_frame        1120           0
.stabstr             333           0
Total             253853
- What does all this mean?
- FLASH = .text + .data
- .text = code which lives and runs out of on-chip FLASH
- .data = initialized variables
- IE:
int myvar=12345;results in 12345 being stored in FLASH and then copied to RAM on power up - Thus .data uses both FLASH and RAM
- IE:
- The other 2 segments are in FLASH space but subtract from the total available
- .nvmApp = Application non-volatile memory
- .simee = SDK non-volatile memory
- RAM = .bss + .data
- .bss = Variables not explicitly initialized
- gcc normally zeroes on power up
- .data = initialized variables
- .heap = heap used for dynamic memory allocation
- .stack = the stack for pushing return addresses, function parameters and other things
- .bss = Variables not explicitly initialized
- The other segments can be largely ignored
- The available FLASH is 256K minus the .simee and .nvmApp=256K-12K-36k=208K
- The available RAM is 64K minus the heap/stack=64K-3K-1K=60K
- Thus:
- FLASH=168760+1132 = 169,892 bytes = 80% utilized
- RAM=28956+1132 = 30,088 bytes = 49% utilized
You can see that the SDK code and the application are all mashed together without a way to identify how much the application is using. But at least you know when you are running out. Note that each release of the SDK will change the amount of flash used by the SDK code and possibly the ZAF. Note that the ZAF is considered part of the Application code.
Commander Flash Map
Another easy way to check how much FLASH is being utilized is to use Commander to display a map of FLASH. Start commander and connect to the DUT then use Device Info->Flash Map to get a chart like this one:

ARM eabi-nm
If you want to know which functions and variables are the biggest chunks of FLASH/RAM usage use the nm command: arm-none-eabi-nm <project.axf> --print-size --size-sort -l | tail -30
Address  Size   Type Symbol
00018c84 00000444 t process_event
0001c760 00000454 T IsMyExploreFrame
000172a4 00000454 T TransportService_ApplicationCommandHandler
000185aa 000004d2 T S2_application_command_handler
0001de00 000004e4 T crypto_scalarmult_curve25519
0001098c 0000054c T IsMyFrame
00017ee4 00000590 t S2_fsm_post_event
00010318 00000674 T IsMyFrame3ch
20006c14 00000708 B channelHoppingBuffer
000138a0 000007e8 T CommandHandler
00021960 00000888 T FRC_IRQHandler
00011790 00000890 T ReceiveHandler
2000628c 000008ac B the_context
20007590 00000c00 N __HeapBase
00019788 00000e04 T mbedtls_internal_sha1_process
00026f68 000019cc T RAILINT_0cdb976df793f6799e20dfa42e2be4c6
00074000 00003000 b nvm3AppStorage
00077000 00009000 B __nvm3Base
00077000 00009000 B nvm3Storage
The third column need a little decoding: T/t=.text (FLASH), B/b=.bss (RAM) D/d=.data (both FLASH and RAM)
You can also tell if it’s FLASH or RAM by the address – FLASH starts at 0 and RAM starts at 0x20000000. Starting from the bottom of the list above you can see that the NVM3Storage is 36K which is naturally the largest block of FLASH. Followed by the 12K of NVM3 Application storage. From there the sizes drop fairly quickly but you can guess the function based on the name. RAILINT is a bunch of Hardware Abstraction Layer (HAL) code. mbedtls is the Security S2 encryption functions. The HEAP is the largest single block of RAM followed by “the_context” which is a fairly large structure the ZAF and the SDK use to store the security and routing information.
Now that you can see the heavy users you can see if there is something amiss. Perhaps a buffer can be reused instead of using unique buffers for various functions. Look carefully for any unused functions in your source code. GCC often will leave “dead” code in place because it can’t tell if you’re using it as a dynamic callback function so to be safe it leaves the code in there. Thus, review your code and make sure you don’t have dead functions or variables or entire buffers that are never used.
The most common method to squeeze more code in is to try various options in the GCC compiler. The more recent versions of GCC have added Link Time Optimization (LTO) which can significantly reduce the code size (claims are up to 20%!). Simplicity Studio is moving to newer versions of GCC later this year so more of these options will be available. Worst case is to refactor your code to make it more efficient or drop features.
Other Tools
There are other tools like Puncover and Bloaty which can help with managing code size growth. I haven’t personally tried these but they seem like they would help. If you use a tool that helps manage code/RAM let me know in the comments below. We all need help in squeezing into the available space which is never enough!
