Coding and Debugging Z-Wave Firmware
This is an abbreviated version of the full blog on the Z-Wave Alliance website.
Each of the silicon vendors, Silicon Labs and Trident IoT, have their own coding and debugging tools and methods. Each vendor has training on their tools which will help you up the learning curve. In this part of the journey, I present my tips and hints to help you up that steep learning curve. The first step is to watch the training videos or read the getting started guides from each vendor. They are well worth your time. While the videos are not particularly entertaining, you can skip through some parts and watch them at 1.5x which is what I did.
Silicon Labs Simplicity Studio 6
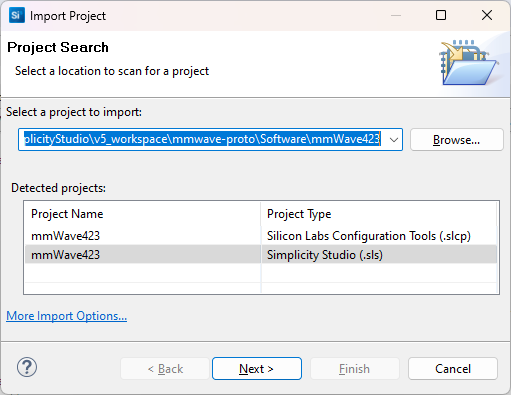
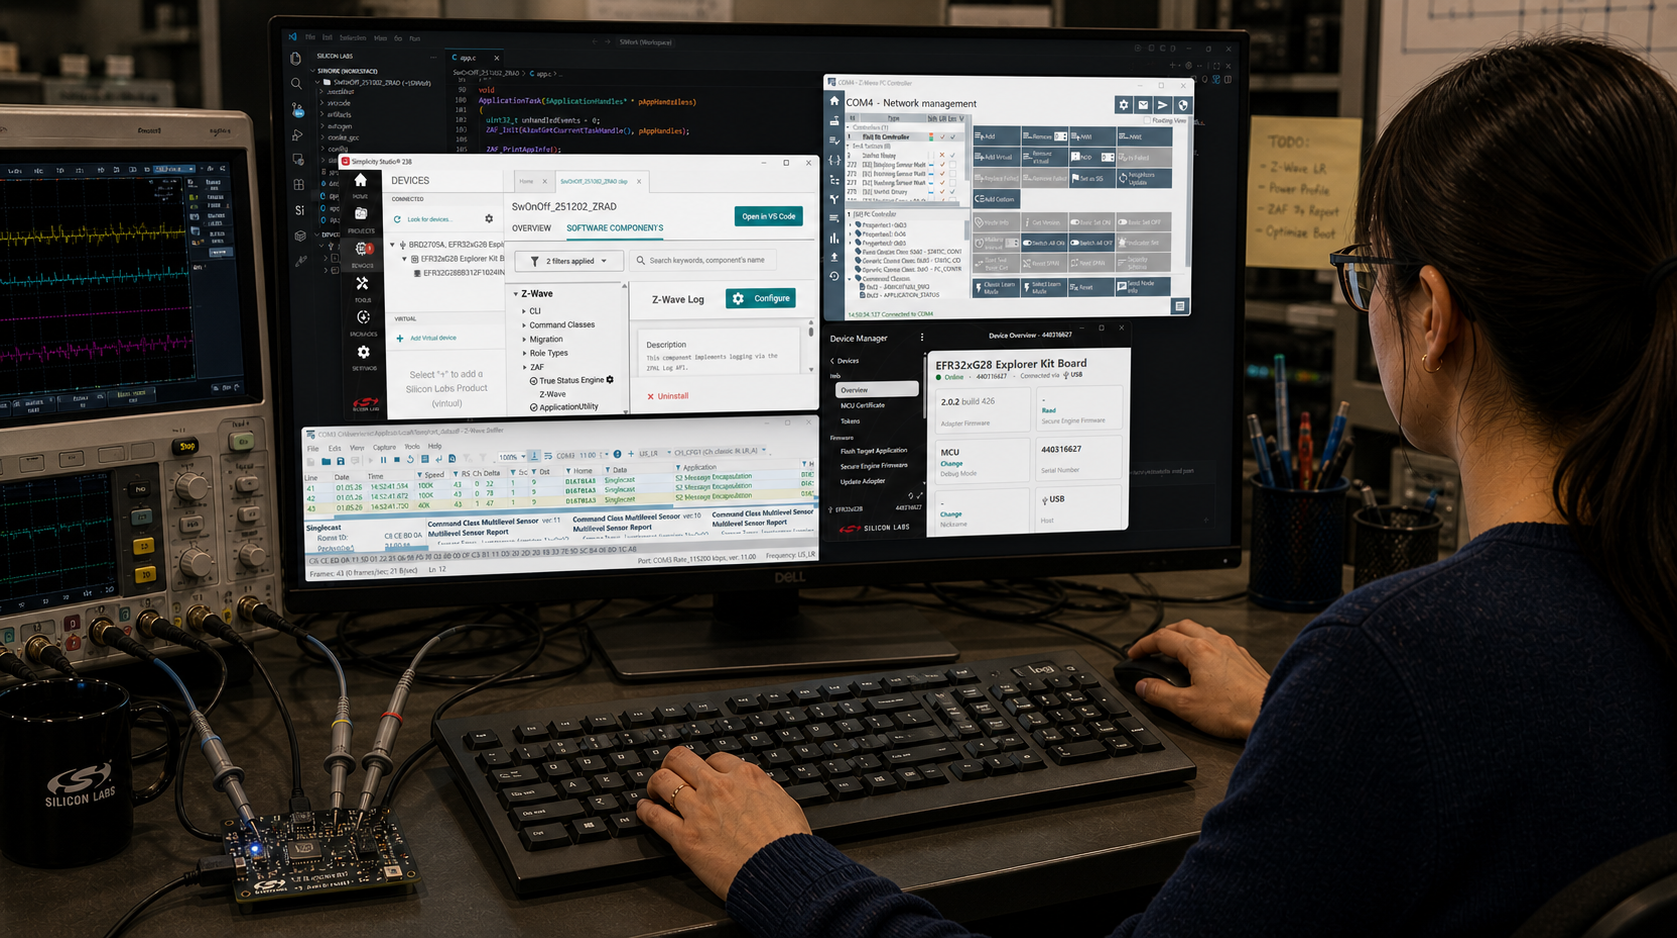
Moving from Simplicity Studio 5 to version 6 requires significant learning as the Integrated Development Environment (IDE) is now based on Microsoft’s Visual Studio Code instead of eclipse. While some parts are familiar, the IDE is markedly different and will take some getting used to. Simplicity Studio 6 (SSv6) is new and has a few wrinkles and rough spots that Silicon Labs will be smoothing out in the coming months. Don’t hesitate to file a case on the support portal or contact your Silabs FAE for help. The first step is to install SSv6 and Visual Studio (VS) Code and the Silabs extension for VS Code. Open SSv6 and you get a broad view of all the wireless protocols Silabs supports, click on Z-Wave to open the list of sample applications. Pick a sample application such as Switch On/Off which is recommended to start with. I recommend using the Copy Contents option. Using the Link SDK and Copy Project Sources option limits VS Code’s ability to find and search through files. The ProjectName.slcp file will open which is where most configuration takes place. The Software Components tab is the doorway to installing command classes or peripheral drivers. Search then install and configure command classes or APIs as needed for your application. The Pin Tool shows a graphical and tabular representation of the GPIOs. The .slpb file is the post-build editor which is where the scripts for keys and OTA file creation are configured but I recommend leaving those at their defaults. Now for the big step – in the upper right corner is the Open in VS Code. Click on that to open the Microsoft tool.
My tips and tricks for using VS Code:
- Always press to save after editing a file!
- SSv5 would automatically save when you click on Build, VS Code does NOT
- It has taken me weeks for this to become a habit. I have been debugging for an hour only to realize the change I made is not in the download because I didn’t hit save
- Copilot AI is a huge productivity improvement – learn it – use it!
- Add a comment to any line of code by typing “//” at the end, Copilot usually produces a decent, often wordy, comment on what the code is doing
- Start typing any function, Copilot fills in the required parameters in the right format(s)
- Start typing “for”, “while” or “switch”, Copilot fills in much of a likely block of code and as you fill in more code, Copilot guesses what else you need – press TAB to accept the suggestion
- Copilot hallucinates – it is not perfect so be careful and obviously check the results
- Searching for variables or functions is different in VS Code than SSv5
- Hovering will display some information, ask Copilot for more details
- Right Click opens a popup with many options – recommend Find All References
- Use the Search menu on the left instead of the bar across the top
- In Files to Include – add “*.c,*.h” otherwise the search will include object files, .map files and other useless hits
- Use the Search menu on the left instead of the bar across the top
- Note that the search is across your entire workspace so look carefully at which project the search result is in
- I sometimes still end up greping to find things
- Can’t see a file in the Si Extension? Use the Explorer tab (upper left) to see all the files
- Clean and then Build from scratch if something is not working
- From the Silabs Extension you can flash firmware, open a terminal, open commander, and other tools
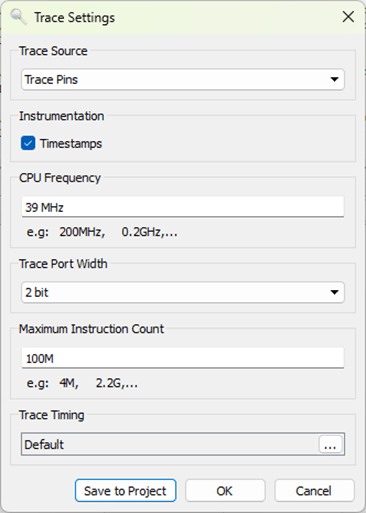
- The gnudbg debugger is reliable
- but I still use Segger Ozone when I hit a really squirrely problem
- Get a new computer with at least 32GB of RAM
- SSv6 and VSCode are memory hogs
- I bought a new laptop with an i9 CPU and 32GB which made the experience more efficient and stable
Trident IoT
Trident takes a quite different approach to embedded programming than Silicon Labs. Building a project, compiling and flashing are done using their command line tool called “Elcap”. Elcap relies on Docker or Podman containers to make for a unified development environment regardless of the platform: Windows, Linux or Mac. Trident has a VS Code plugin called “TIDE” which makes for a familiar environment for writing and exploring the embedded code. These features make for frictionless setup as the environment is encapsulated within the container. The container environment also makes support easier as the entire environment can be recreated months or years later and reproduce the identical firmware download. They also claim that upgrading to newer SDK versions will be possible with a single command line. Silabs developers usually must rebuild their entire application starting from a fresh sample application in a newer SDK to upgrade.
Trident IoT Tips and Tricks:
- Use the latest version of elcap – elcap about
- elcap self doctor – checks your environment, execute this if something is not working
- The problem is you usually need to start the Docker Desktop application
- Append –help to any elcap command for more information
- Trident relies on the Segger Ozone Debugger
- VS Code integration with Ozone is expected in a future release. elcap creates a Segger .jdebug file for Ozone as part of the build process
- In config.cmake set the following so Ozone finds all source code
- Set(ZWDSK_CONFIG_USE_SOURCES “ON”)
- Takes a little longer to compile but can single step ALL the code
- Turn it off again when close to release for faster compile times
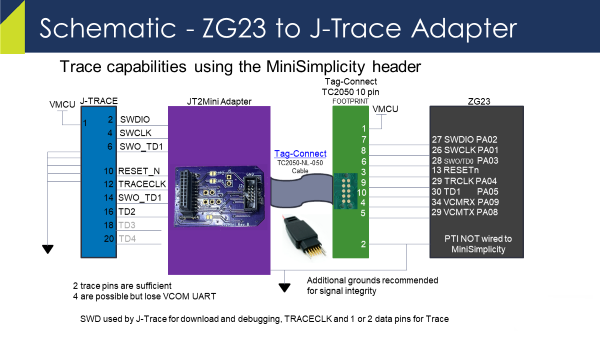
- Use a Segger J-Link to debug your own PCB
- The connector pinout is NOT the same as the Silabs MiniSimplicity header. The Trident devkit has a J-Link built in but does not debug external PCBs
- The DKR-HOST can be used to debug trident based PCBs
- The build environment is based on CMake
- To configure the project, edit:
- CMakeLists.txt
- App/CMakeLists.txt
- Configuration will be simplified in a future release
- To configure the project, edit:
- Complete reference firmware is available on request for several sensor types
- Start the PCC, Zniffer or Tridents own cross-platform Z-Wave/Zigbee Sniffer from elcap
Next Steps
Part 5 of the Z-Wave Developer’s Journey discusses an often-overlooked schedule hit that in my view is absolutely critical, Firmware Hardening. Developers must keep in mind that IoT devices are often wired to mains power and may run for years without ever rebooting. Thus, the firmware must be resilient to account for impossible conditions that should never happen, but in the real world they often do. Remaining connected to the Z-Wave network and never “bricking” is critical to the success of your product and the reputation of Z-Wave. Do you have some Tips and Tricks to share? Please reach out to me directly via email.